NGESA
New Web Interface for Reporting, Quarantine, and Tracking
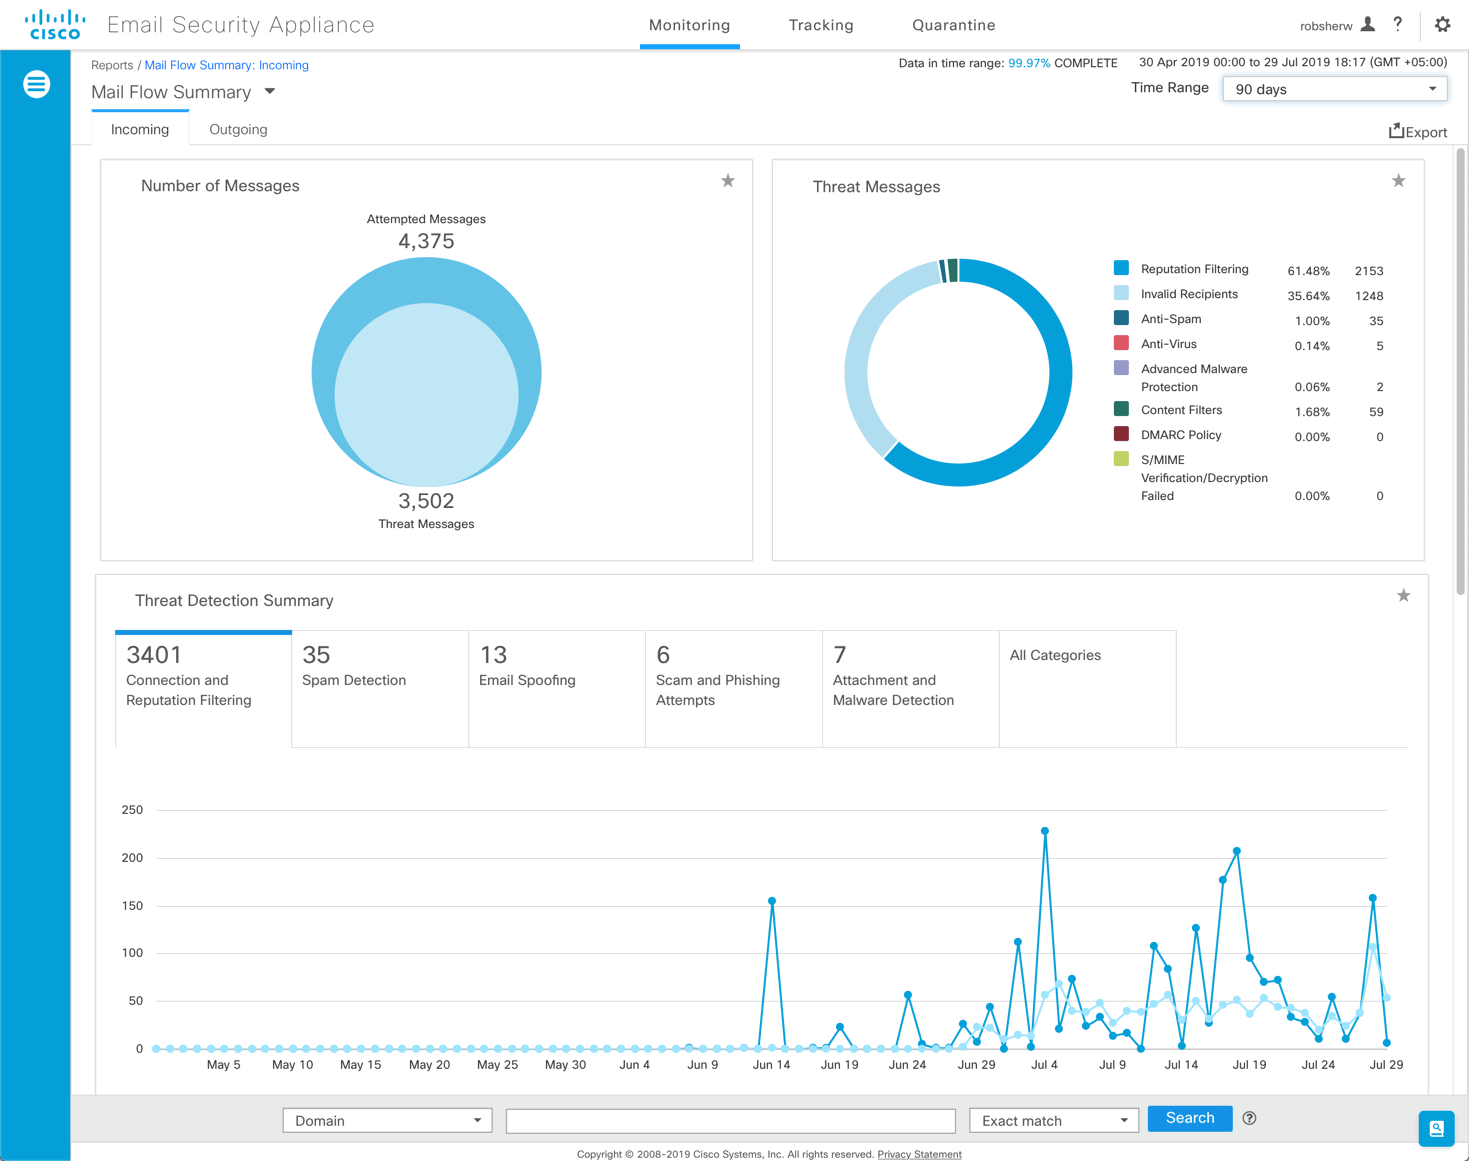
The appliance now has a new web interface to search and view:
• Email Reports. You can now view email reports from the Reports drop-down based on the following categories:
- Email Threat Reports
- File and Malware Reports
- Connection and Flow Reports
- User Reports
- Filter Reports
For more information, see the “Email Security Monitor Pages on the New Web Interface” chapter in the user guide.
• Spam Quarantine
- You can now view and search for spam and suspected spam messages in Quarantine > Spam Quarantine > Search page in the web interface.
- You can view, add, and search for domains added in the safelist and blocklist in Quarantine > Spam Quarantine > Safelist or Blocklist page in the web interface.
For more information, see the "Spam Quarantine" chapter in the user guide.
• Policy, Virus and Outbreak Quarantines. You can view and search for policy, virus and outbreak quarantines in Quarantine > Other Quarantine > Search page in the web interface. For more information, see the “Centralized Policy, Virus, and Outbreak Quarantines” chapter in the user guide.
• Message Tracking. You can search for messages or a group of messages depending on your search criteria in Tracking > Search page in the web interface. For more information, see the “Tracking Messages” chapter in the user guide.
Important!
• Make sure that you have enabled AsyncOS API on the appliance.
• By default, trailblazerconfig is enabled on the appliance.
- Make sure that the configured HTTPS port is opened on the firewall. The default HTTPS port is 4431.
- Also, ensure that your DNS server can resolve the hostname that you specified for accessing the appliance.

REPORTING
Reporting on NGESA is machine level only on ESA; Cluster-level reports are seen from NGSMA only
ESA

SMA

Updated over 2 years ago
